
Are you the type of runner that loves the climbs? You are part mountain goat. You can power hike the heck out of a hill. Or are you a downhiller? You take full advantage of gravity and fly down the trail. Quads be damned!
The elevation profile of a race shows you where the course climbs up and when it comes back down. You can see how steep the ups and downs are and where they occur throughout the route, as well as what elevation the race is occurring. The gain number is how much you climb over the duration of the race. The loss number is the total amount you’ll descend. This is helpful in choosing which races to sign up for. You can pick those that play to your strengths or choose one or two that will push you outside your comfort zone. The profile is also useful for planning your day’s strategy; knowing if you’ll need to save a little gas in the tank for a big climb or when to open the throttle.
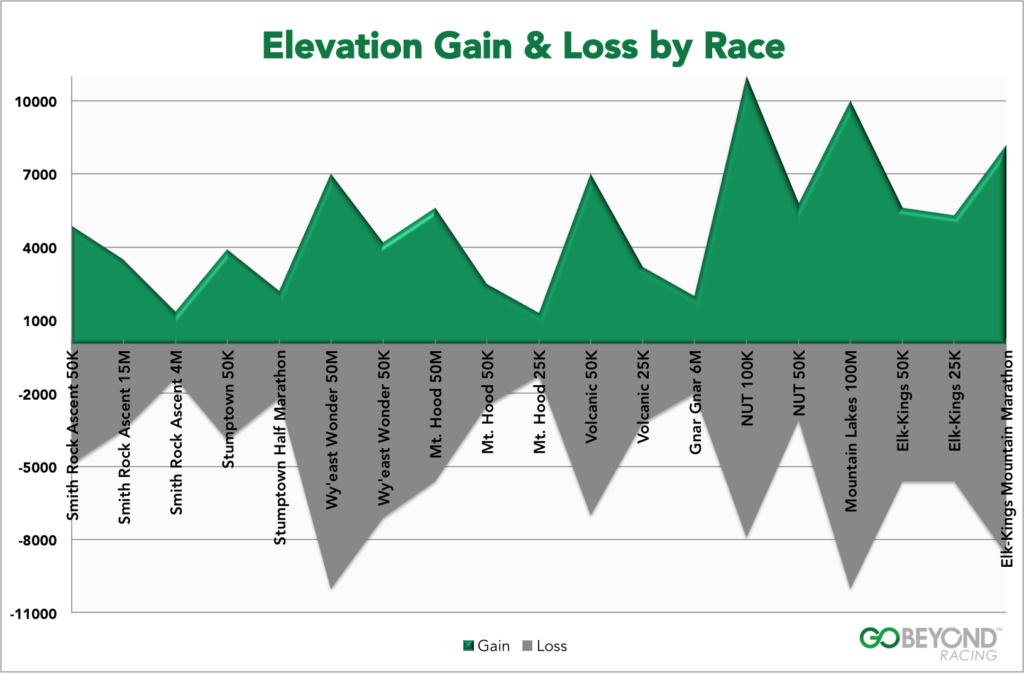
This chart lists the gain and loss, in feet, for each of our 2019 races. The above graphic is like an elevation profile, but really just shows you the gain and loss for all the races in a more fun way.
| Go Beyond Race | Gain | Loss |
| Smith Rock Ascent 50K | 4,900 | 4,900 |
| Smith Rock Ascent 15M | 3,500 | 3,500 |
| Smith Rock Ascent 4M | 1,370 | 1,370 |
| Stumptown 50K | 3,900 | 3,900 |
| Stumptown Half Marathon | 2,200 | 2,200 |
| Wy’east Wonder 50M | 7,000 | 10,000 |
| Wy’east Wonder 50K | 4,200 | 7,100 |
| Mt. Hood 50M | 5,600 | 5,600 |
| Mt. Hood 50K | 2,500 | 2,500 |
| Mt. Hood 25K | 1,300 | 1,300 |
| Volcanic 50K | 7,000 | 7,000 |
| Volcanic 25K | 3,200 | 3,200 |
| Gnar Gnar 6M | 2,000 | 2,000 |
| NUT 100K | 11,000 | 7,900 |
| NUT 50K | 5,800 | 3,100 |
| Mountain Lakes 100M | 10,000 | 10,000 |
| Elk-Kings 50K | 5,600 | 5,600 |
| Elk-Kings 25K | 5,300 | 5,600 |
| Elk-Kings Mountain Marathon | 8,200 | 8,600 |
Choose wisely grasshopper. Go Beyond races aren’t easy, but that’s why you like them.